Zebrafish Bacterial Load Analyzer
These pages are in support of:
Zebrafish embryo screen for mycobacterial genes involved in initiation of granuloma formation reveals a novel ESX-1 component.
Esther J.M. Stoop, Tim Schipper, Sietske K. Rosendahl Huber, Alexander E. Nezhinsky,
Fons J. Verbeek, Sudagar S. Gurcha, Gurdyal S. Besra, Christina M.J.E. Vandenbroucke-Grauls,
Wilbert Bitter and Astrid M. van der Sar
Disease Models and Mechanisms, Submitted (2010)
The research/experimental procedures on bacterial load was performed at the VUMC, Amsterdam, the Netherlands.
We collaborated in this project in designing and implementing software for the quantification of bacterial load.
In order to quantify bacterial load in zebrafish, fluorescent images of infected zebrafish embryos were analyzed with specially designed,
dedicated software. For the analysis, 3 types of images are distinguished.
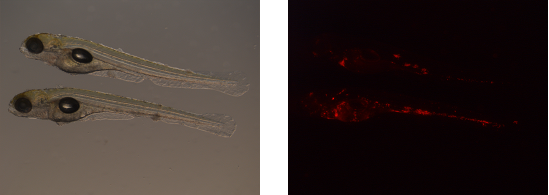
Images are acquired of one and the same zebrafish embryo using bright-light (left) and a fluorescent (right) microscope setup.
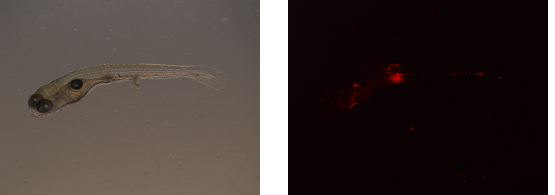
First, blanco images are obtained. Blanco images are acquired with the fluorescent microscope and contain embryos that are not infected. Consequently, from these images, the average fluorescence background can be established per experimental set.
Second, the reference images are obtained. These reference images are acquired with the fluorescent microscope and contain embryos infected with wildtype bacteria. Each reference image is thresholded by the background value obtained from the blanco images.
Per image the sum of the pixels from the red fluorescent channel above the threshold is divided by the number of embryos. This is done so for the whole set of images in an experiment. This measurement provides us a reference value of the amount of (red) fluorescent pixels per embryo at 100% infection.
The procedure for the reference images is repeated for each experimental image in the set and subsequently, the amount of (red) fluorescent pixels is provided as a percentage with respect to the level of the infection in the wildtype.
Results are written to a comma separated file so that further statistical analysis and classification can be applied to the data. The processing does not require any operator interaction as all threshold values are derived from the images.
The following screenshots illustrate the mode of operation the zebrafish bacterial load analyser. Version 2.0 of the interface.
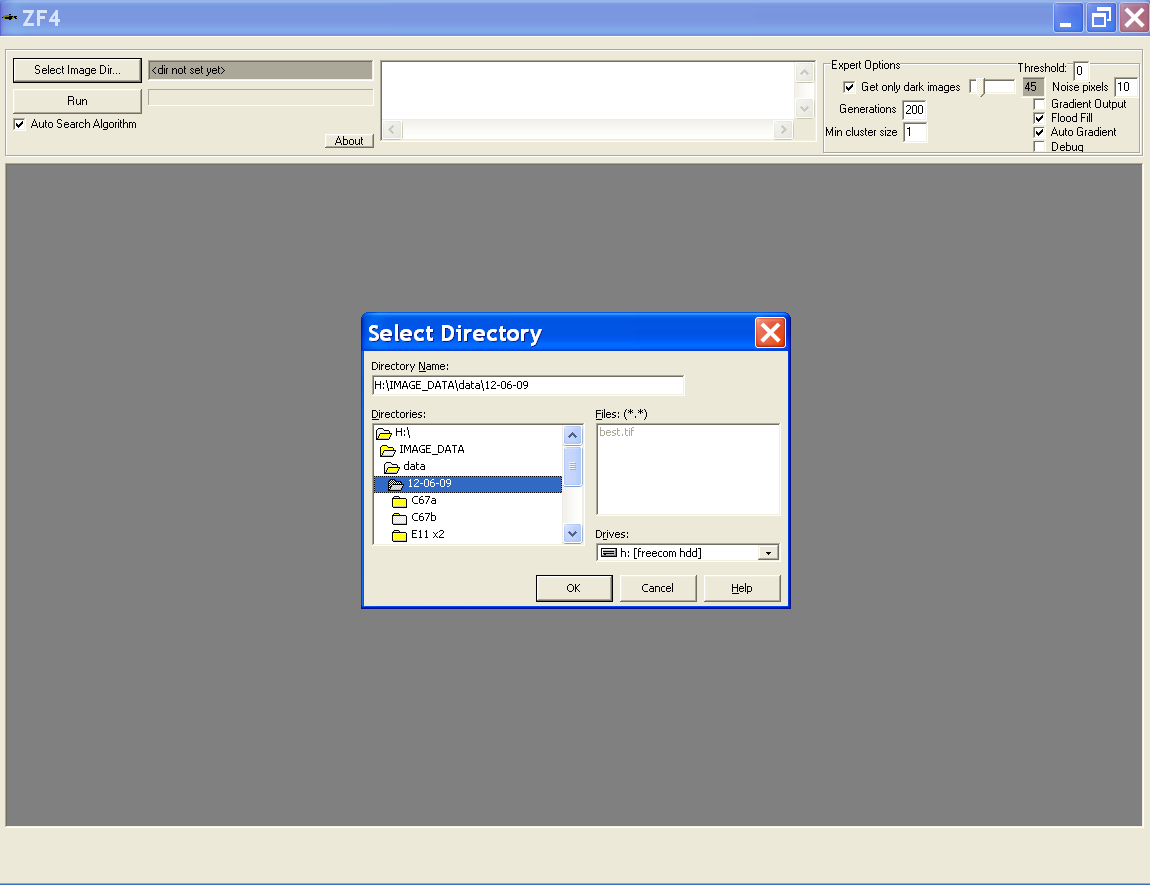
Choosing directories containing images
- Select the directory where the images are located
- Directory that was used last time will be prompted as default directory
- This can also be modified using the path.txt file
Presentation of the images to the user
- Subdirectories of the chosen directory are threatened as groups
- Groups are displayed each in own column
- Images in groups are presented int the interface as thumbnails
- The colors of the thumbnails are inverted and brightness is auto-set to enable more clear view of locations of the specimens
- The path of every group is given and can be expanded by a mouse over
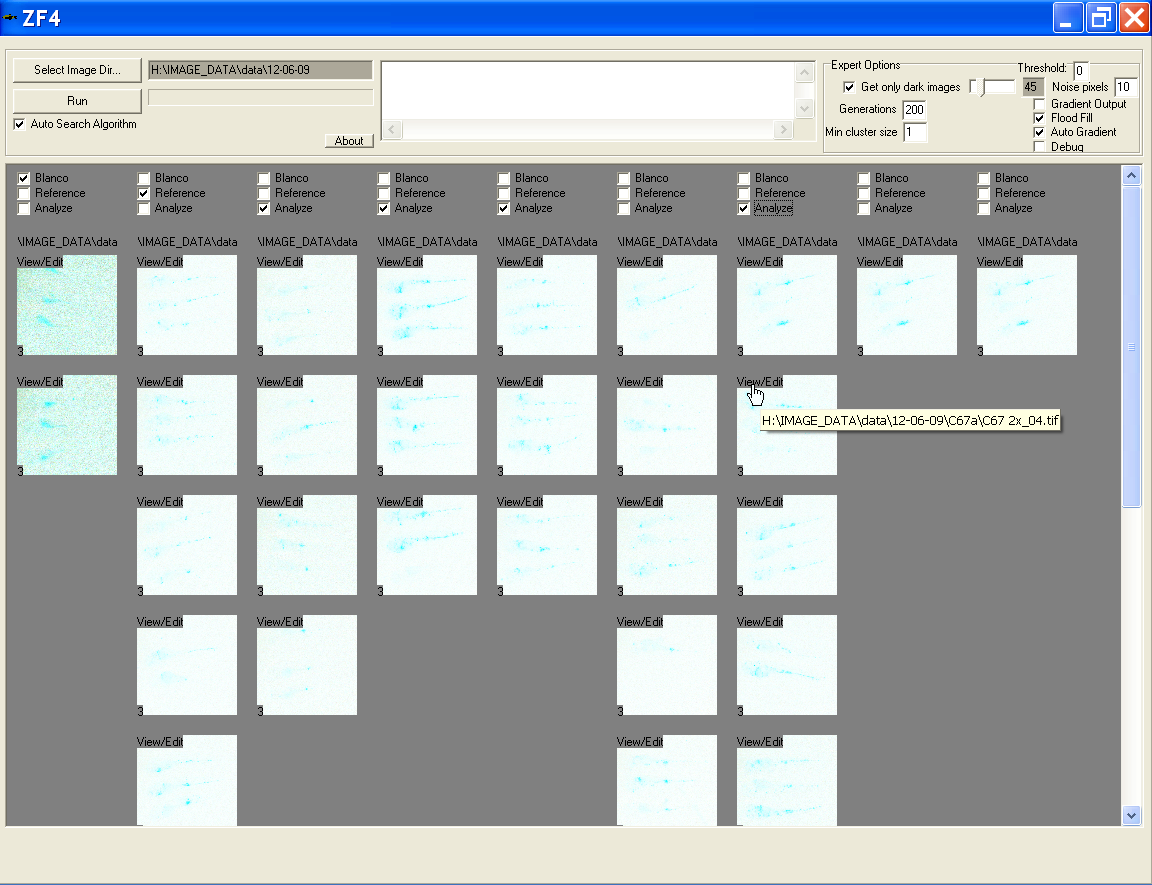
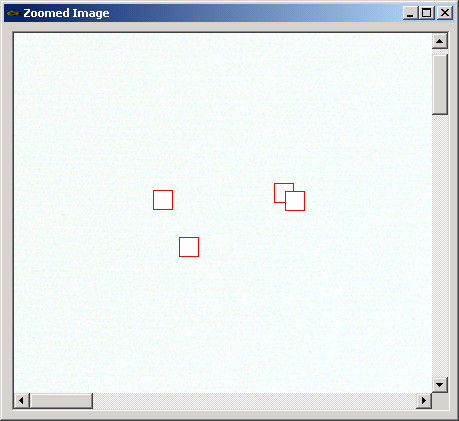
View/edit image
- Click the view/edit in top left corner on any thumbnail to open it in new window
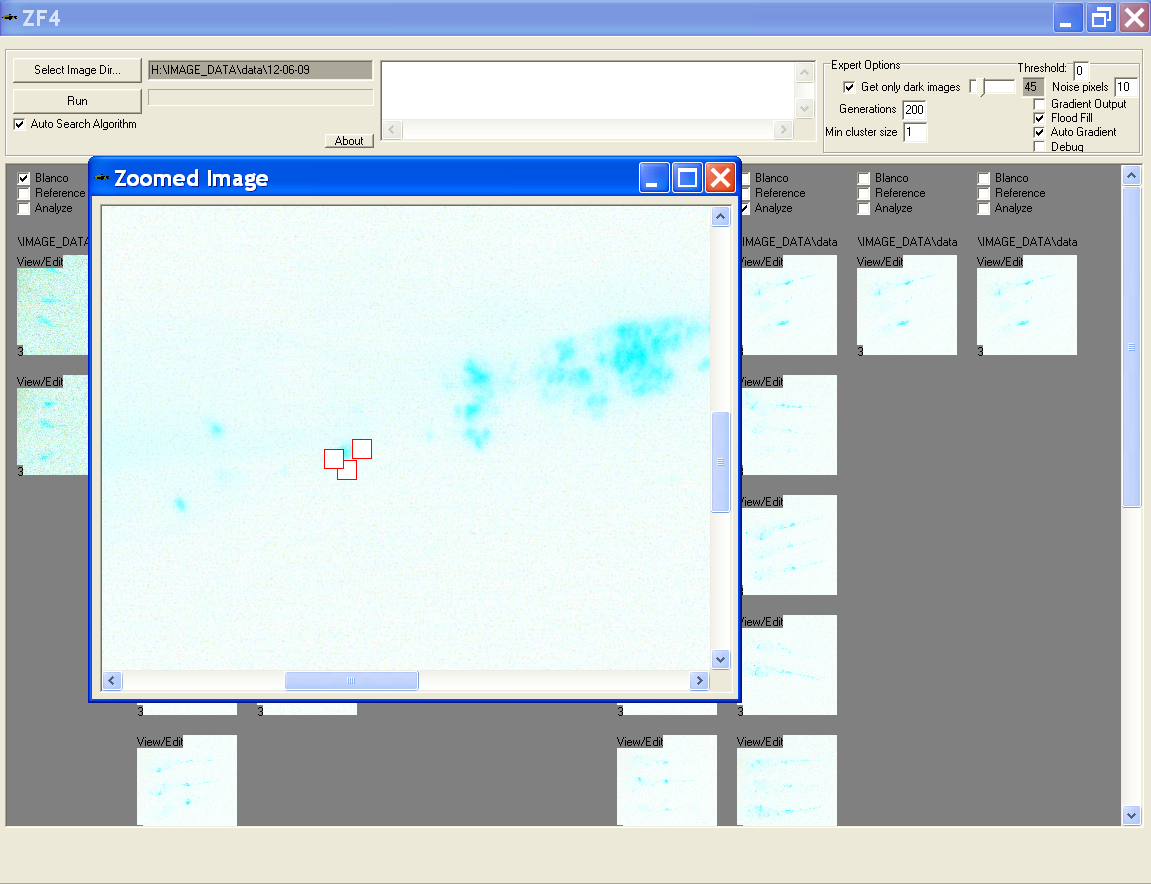
- In this window the user can scroll through full scale image and click on any noise pixels to remove them and therewith exclude them from the measurement
- A dialog is prompted to save the changes after closing this window
- Click on the number in bottom left corner of each thumbnail to change the number of specimens (zebrafish) in an image
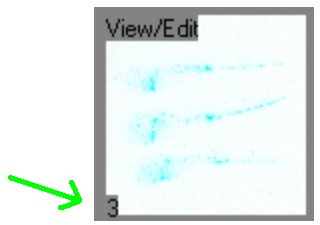
- Setting this number by hand is not required if automatic detection algorithm will is used. In this case the number of specimens in each image will be determined automatically.
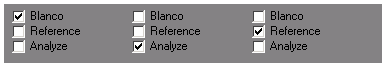
Select image type
- Each group should be set as containing Blanco images, Reference images, or images that will be analyzed. This can be done with the checkboxes above each group. More then one selection is possible.
- Reference: images that are considered not to have any bacteria
- Blanco: images that are considered to have standard (100%) amount of bacteria
- Analyze: the images that are to be analyzed
Running the algorithm
- Select Run to start the algorithm.
- Some of the fields that are written are:
- FileName: image file name
- NumberOfFish: the number of fish in the image (preset by the user or automatically calculated)
- BacteriaPixels: number of pixels seen as bacteria
- ReferenceBacteriaPixels: number of pixels seen as bacteria in Blanco
- Percentage: 100*BacteriaPixels/ ReferenceBacteriaPixels
- SetPercentage: average percentage of the whole set
- some measurements on clustering of the bacteria are done
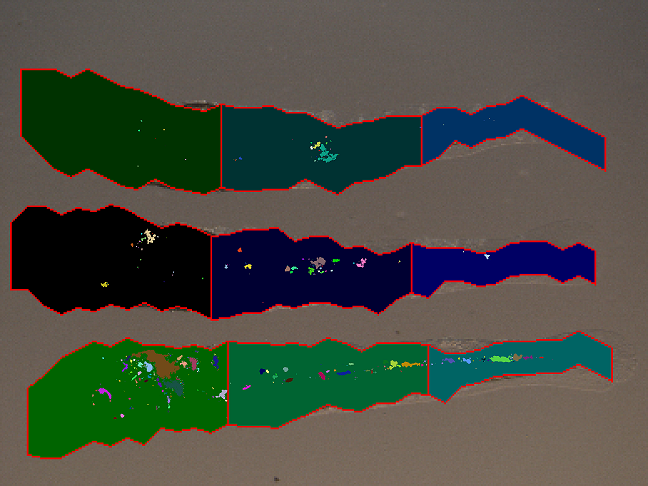
- The approximated shapes are printed on each the light microscope input image
- The fluorescent microscope images are overlayed on this images to show bacteria spread
- The clusters are printed in different colors
Contact Alexander Nezhinsky or Fons Verbeek for information.
For more information, see also:
Nezhinsky A., Verbeek F.J. (2010)
Pattern recognition for high throughput zebrafish imaging using genetic algorithm optimization.
5th IAPR Conference on Pattern Recognition in BioInformatics (PRIB 2010).
Lecture Notes in BioInformatics 6282, Springer, (Berlin - Heidelberg) 301-312